
How to Build a Data-Driven CAT Preparation Strategy – Mock Analytics & Accuracy Tips
Focus: Using Mock Analytics, Accuracy Tracking, and Speed Optimization
Introduction: Stop Guessing. Start Preparing Like a Topper.
Most CAT aspirants prepare based on intuition, motivation, or random study plans. They solve questions daily but fail to systematically improve their scores. The biggest difference between average aspirants and CAT toppers is this:
👉 Toppers use data to guide every preparation decision.
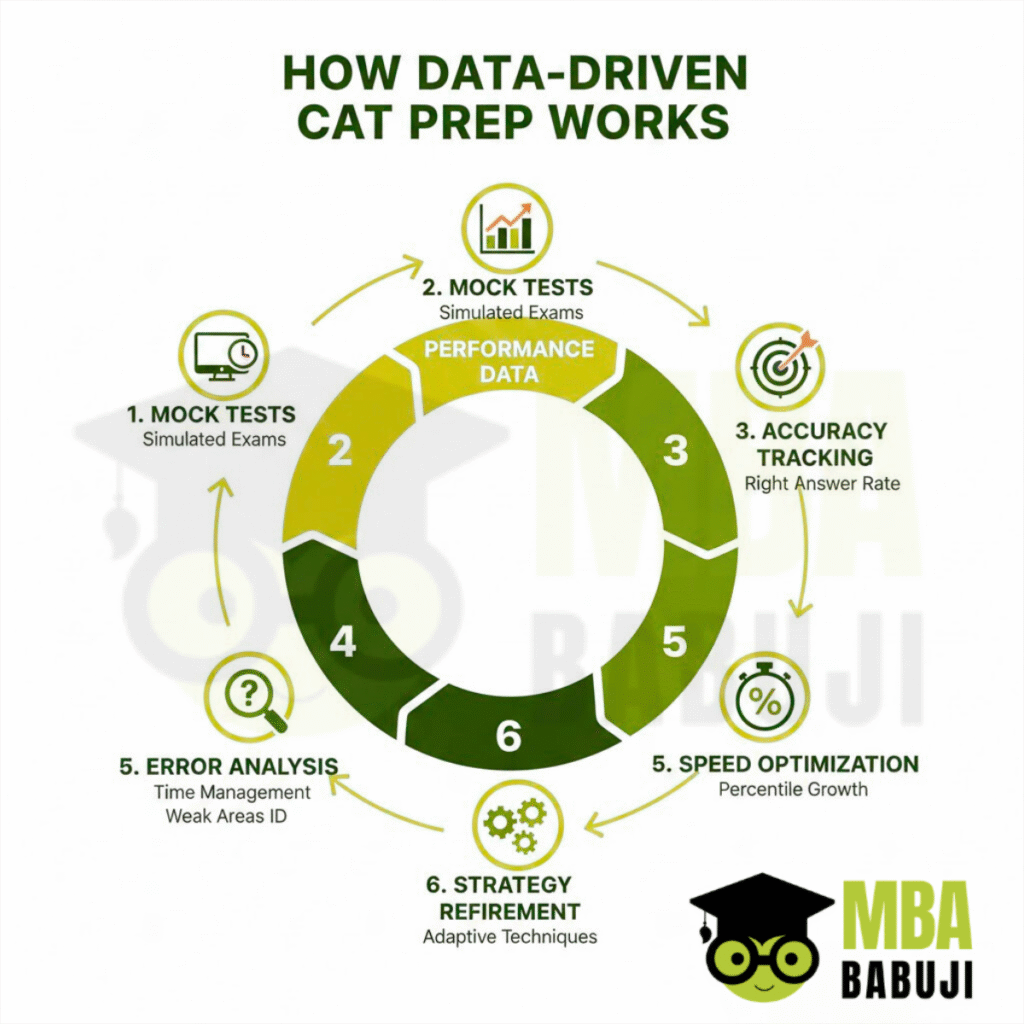
A data-driven CAT preparation strategy means using mock test analytics, accuracy tracking, and speed metrics to decide:
- What to study
- What to revise
- What to skip
- How to increase percentile strategically
This article explains how to build a scientific, measurable, and result-oriented CAT preparation plan.
What Does “Data-Driven CAT Preparation” Mean?
A data-driven approach focuses on numbers, patterns, and measurable performance trends, not emotions or assumptions.
Instead of saying:
❌ “I feel weak in VARC.”
You say:
✅ “My VARC accuracy is 68%, and RC inference questions cause most errors.”
You analyze:
- Mock scores over time
- Section-wise accuracy
- Time spent per question
- Mistake patterns
- Strength vs weakness topics
This transforms preparation into a performance optimization system.
Step 1: Use Mock Tests as a Data Source, Not Just Practice
Mocks are not only for score prediction. They are performance diagnostic tools.
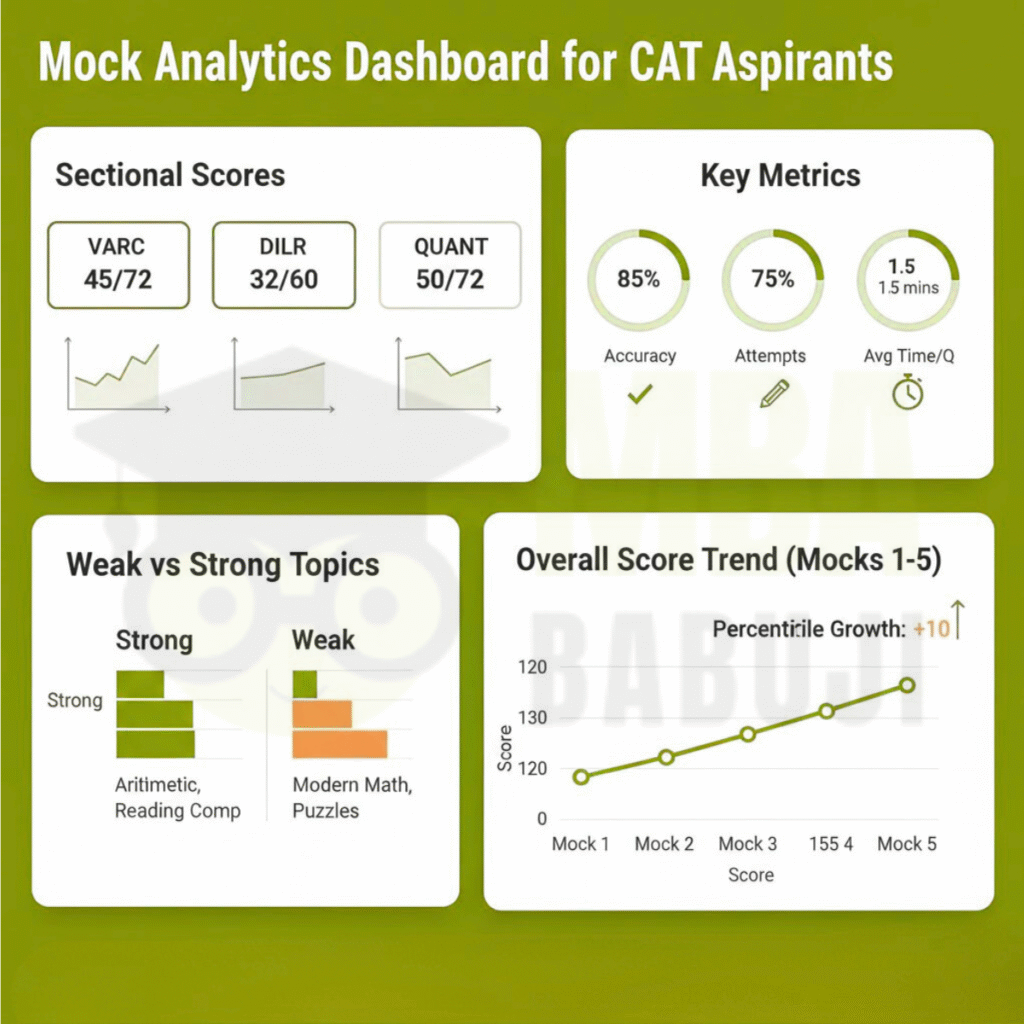
Track These Key Mock Metrics:
- Sectional scores (VARC, DILR, QA)
- Accuracy percentage
- Attempt count per section
- Time spent per question
- Question-type performance
- Easy vs moderate vs difficult success rate
Key Rule:
👉 Mocks are valuable only when analyzed deeper than attempted.
Top performers spend 2–3x more time analyzing mocks than attempting them.
Step 2: Build a Topic-Wise Performance Dashboard
Create a simple performance tracker (Excel / Notion / Notebook) with:
- Topic name
- Attempts
- Accuracy
- Average time per question
- Error type
Example:
| Topic | Attempts | Accuracy | Avg Time | Status |
|---|---|---|---|---|
| Algebra | 45 | 62% | High | Weak |
| Arithmetic | 38 | 81% | Medium | Strong |
| RC Inference | 30 | 55% | High | Priority Fix |
This helps you focus effort where it actually improves scores.
Step 3: Accuracy Tracking — The Biggest Score Booster
Increasing accuracy by 5–10% often improves the percentile more than increasing attempts.
Ideal Accuracy Benchmarks:
- VARC: 75–85%
- DILR: 70–80%
- Quant: 75–90%
Track Accuracy in 3 Levels:
- Overall Accuracy
- Topic-wise Accuracy
- Difficulty-wise Accuracy
Fix Accuracy by:
- Reviewing wrong answers deeply
- Categorizing errors (conceptual, careless, rushed)
- Maintaining an Error Log Notebook
- Re-attempting wrong questions after 7 days
Step 4: Error Categorization — Learn from Every Mistake
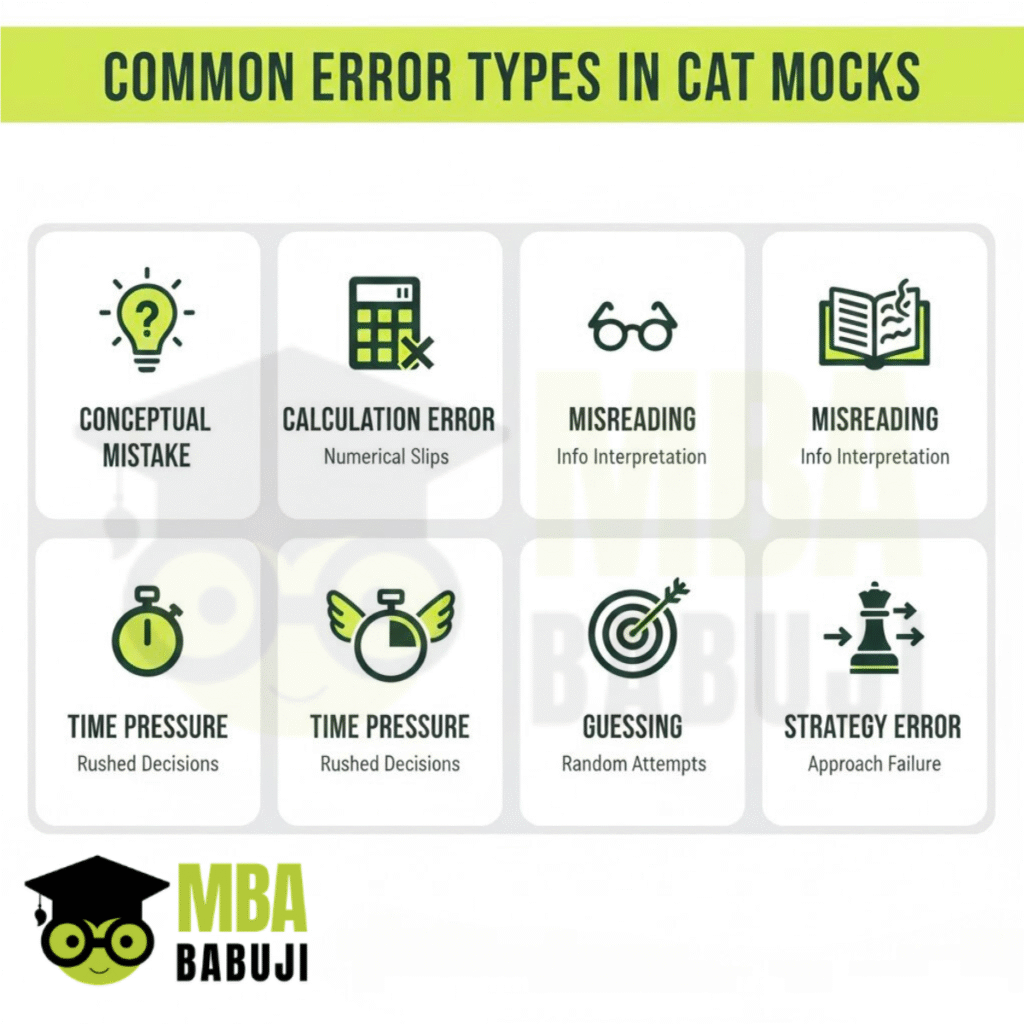
Every wrong answer must fall into one category:
Error Types:
- ❌ Conceptual gap
- ❌ Calculation mistake
- ❌ Misread question
- ❌ Time pressure error
- ❌ Guessing mistake
- ❌ Strategy mistake
Golden Rule:
👉 Never repeat the same mistake twice.
Your mistake log should become your most powerful revision resource.
Step 5: Speed Optimization Using Time Analytics
Many aspirants lose marks not due to weak concepts but due to poor time management.
Track:
- Time per correct question
- Time per incorrect question
- Time wasted on skipped questions
- Questions consuming more than 2 minutes
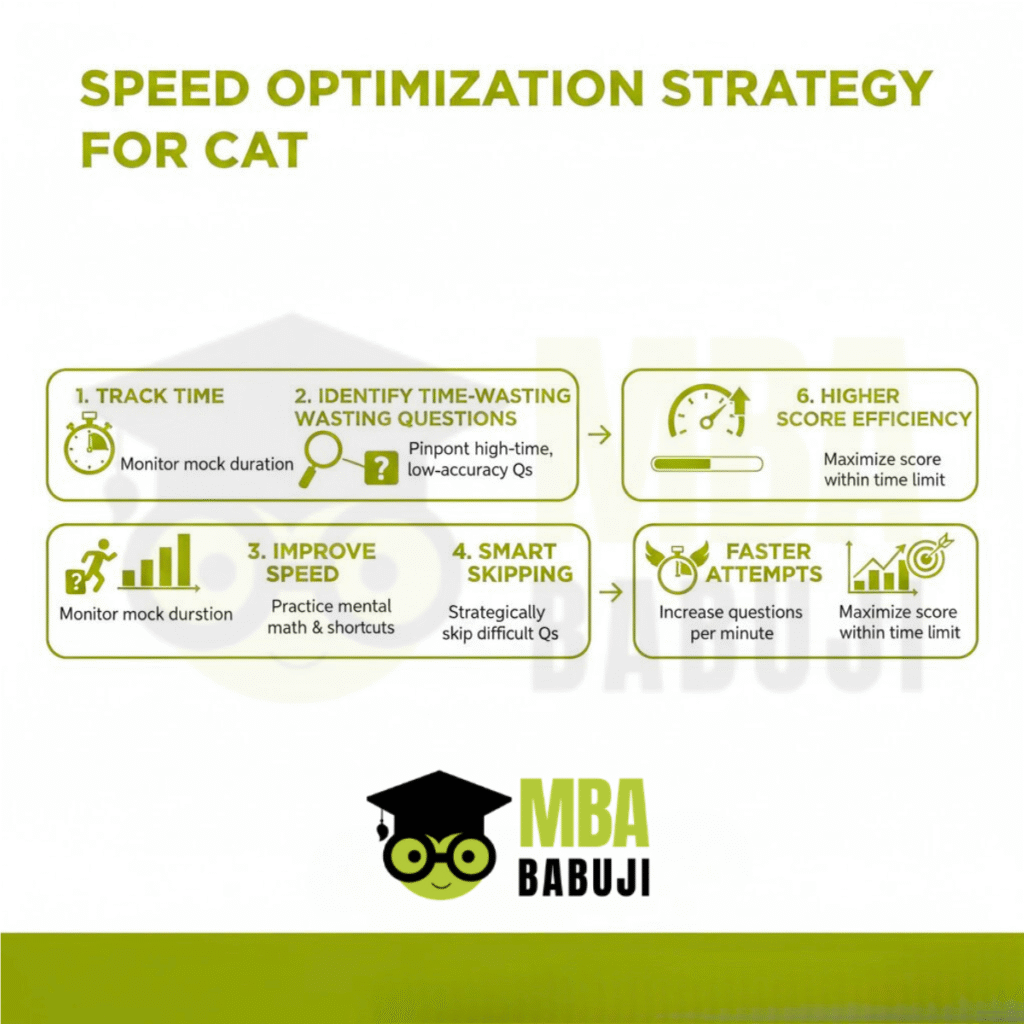
Optimize Speed By:
- Reducing time on low-value questions
- Pre-deciding skip strategy
- Practicing timed topic drills
- Building a fixed attempt plan per section
Example Target:
- VARC: 20–24 attempts
- DILR: 2–3 sets
- Quant: 14–18 questions
Step 6: Identify High-ROI Topics Using Data
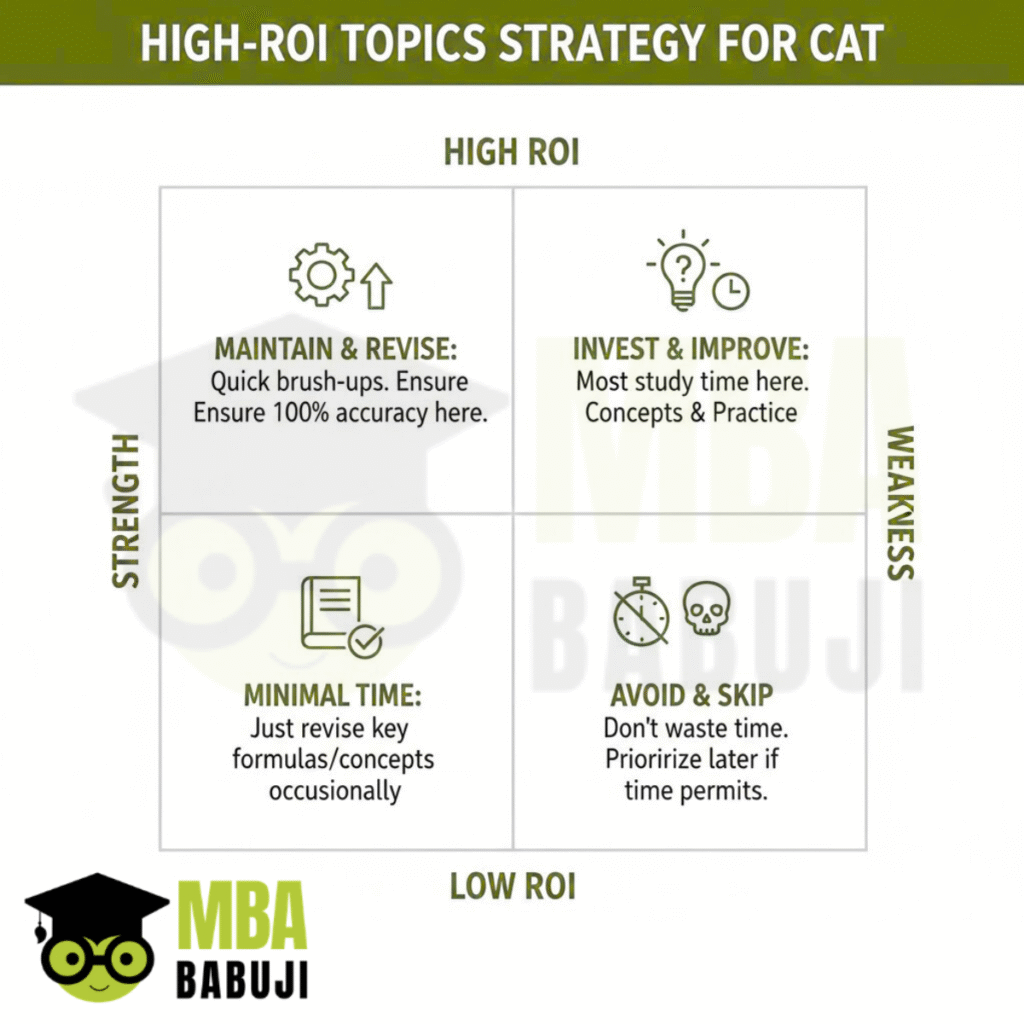
Not all topics deserve equal time.
Prioritize topics that:
- Appear frequently in CAT
- Have high scoring potential
- Show strong improvement potential
- Offer accuracy above 70%
Strategy:
- Strength topics → Maximize speed
- Medium topics → Improve accuracy
- Weak topics → Fix basics or minimize loss
👉 Smart aspirants maximize returns, not workload.
Step 7: Section-Wise Strategy Based on Performance Trends
VARC Strategy:
- Track RC vs VA accuracy
- Identify weak RC question types
- Improve reading speed + inference logic
DILR Strategy:
- Track set selection success
- Practice choosing the right sets, not more sets
Quant Strategy:
- Identify calculation-heavy vs logic-heavy strengths
- Improve speed in arithmetic & algebra
Step 8: Use Score Trends to Adjust Weekly Study Plan
Every week, analyze:
- Score growth
- Accuracy improvement
- Time efficiency
- Weak topic improvement
Adjust Plan Based On:
- Sections needing more time
- Topics with high ROI
- Mistakes repeating frequently
This makes your preparation adaptive and evolving.
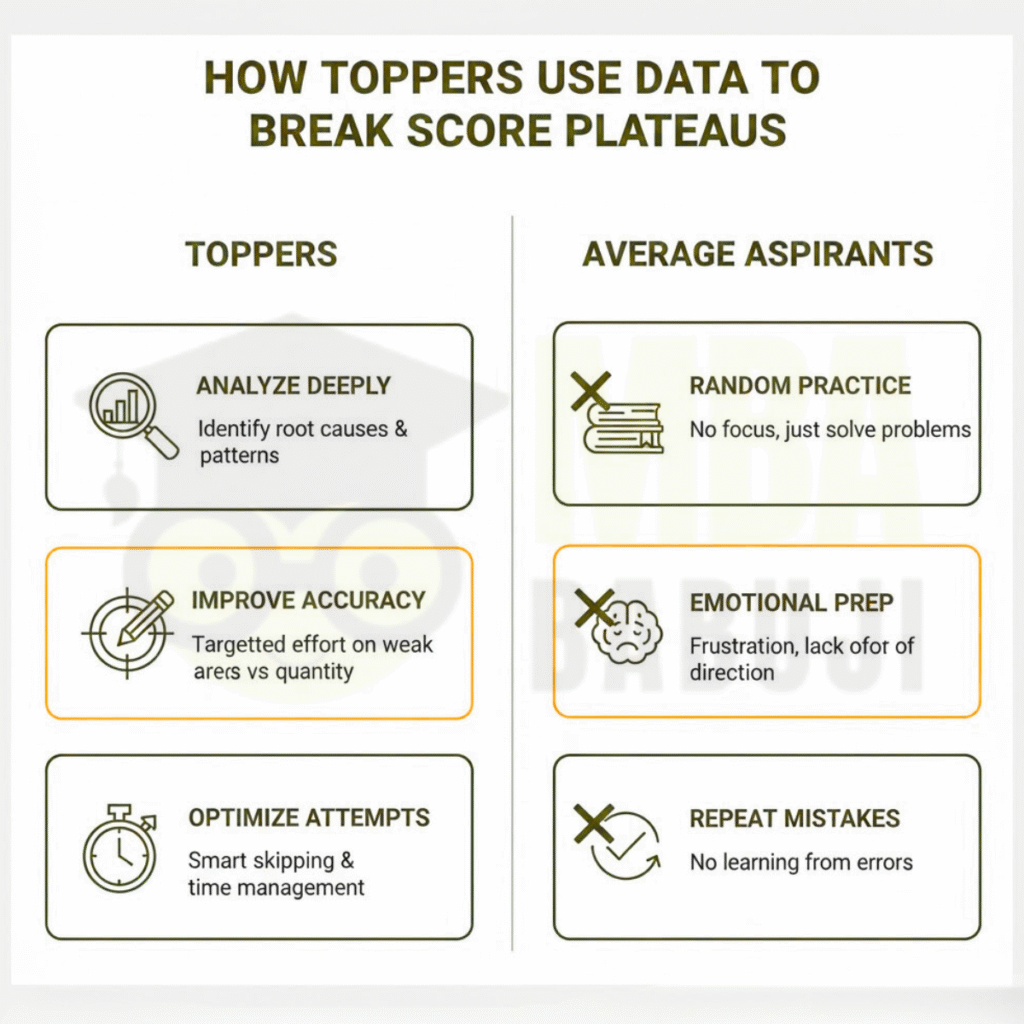
Step 9: How Toppers Use Data to Break Score Plateaus
When scores stagnate, toppers:
- Reduce attempts to improve accuracy
- Eliminate time-wasting question types
- Improve decision-making in mocks
- Practice targeted drills instead of random practice
Mindset Shift:
❌ “Study more.”
✅ “Study smarter based on performance data.”
Conclusion: CAT is Not About Hard Work Alone — It’s About Smart Optimization
CAT rewards aspirants who measure, analyze, optimize, and adapt.
A data-driven CAT preparation strategy helps you:
- Improve scores predictably
- Reduce wasted effort
- Focus on high-impact areas
- Build top-level decision skills
👉 Track your performance like an analyst, prepare like a strategist, and execute like a topper.
FAQs Section (SEO + Student-Focused)
1. What is a data-driven CAT preparation strategy?
A data-driven strategy uses mock test analytics, accuracy tracking, time management metrics, and performance trends to guide preparation instead of guesswork.
2. How often should CAT aspirants analyze mock tests?
Ideally, after every mock. Toppers spend 2–3 times more time analyzing mocks than attempting them.
3. What accuracy percentage is ideal for CAT?
- VARC: 75–85%
- DILR: 70–80%
- Quant: 75–90%
Higher accuracy usually leads to a better percentile than more serious attempts.
4. How can I improve my CAT score using mock analytics?
Track weak topics, reduce repeated mistakes, optimize time per question, improve accuracy, and adjust attempt strategy based on performance data.
5. How do toppers use data differently from average aspirants?
Toppers track errors, analyze time usage, improve decision-making, prioritize high-ROI topics, and revise based on actual performance trends.
6. Is speed or accuracy more important in CAT?
Both matter, but accuracy is more critical. Increasing accuracy often boosts the percentile more than increasing attempts.
7. How long does it take to see improvement using a data-driven approach?
Most aspirants start seeing score improvement within 4–6 weeks of consistent tracking and targeted optimization.


